Hackathon : Unleash the Art of Data
Allianz Benelux organized a hackathon around the question: How best to visualize insurance data, and what can we learn from it?
Not knowing the dataset beforehand, we set out to explore it with a team of three. An anonymized datasets with cars, car trips, GPS points, and claims was provided.
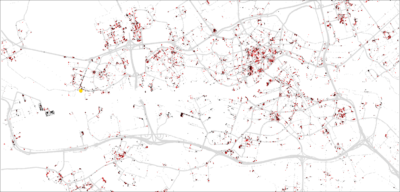
After plotting them, the GPS points themselves clearly outlined a map of the Netherlands with dots where cars had been. A second layer was plotted on top of this map with colored dots indicating location of car trips and driver behaviour. An actual correlation between safe car trips and the quality of living environment (leefbaarometer) was found. Finally the beautiful chart was immortalized by painting a detail of it on a canvas.
Visualisation GPS points and trips
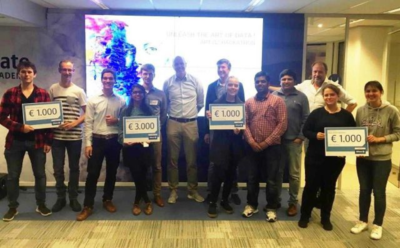
The results themselves were so insightful that we won this first Allianz hackathon! For Allianz the hackathon was definitely a success and is currently becoming a recurring event.
Jury and prize winners


